One pipeline, four ways of reading it.
Your CRM gives you one attribution model and presents it as the answer. Sygnal shows four, recomputed live from the same journeys, and every number opens into the named companies behind it.
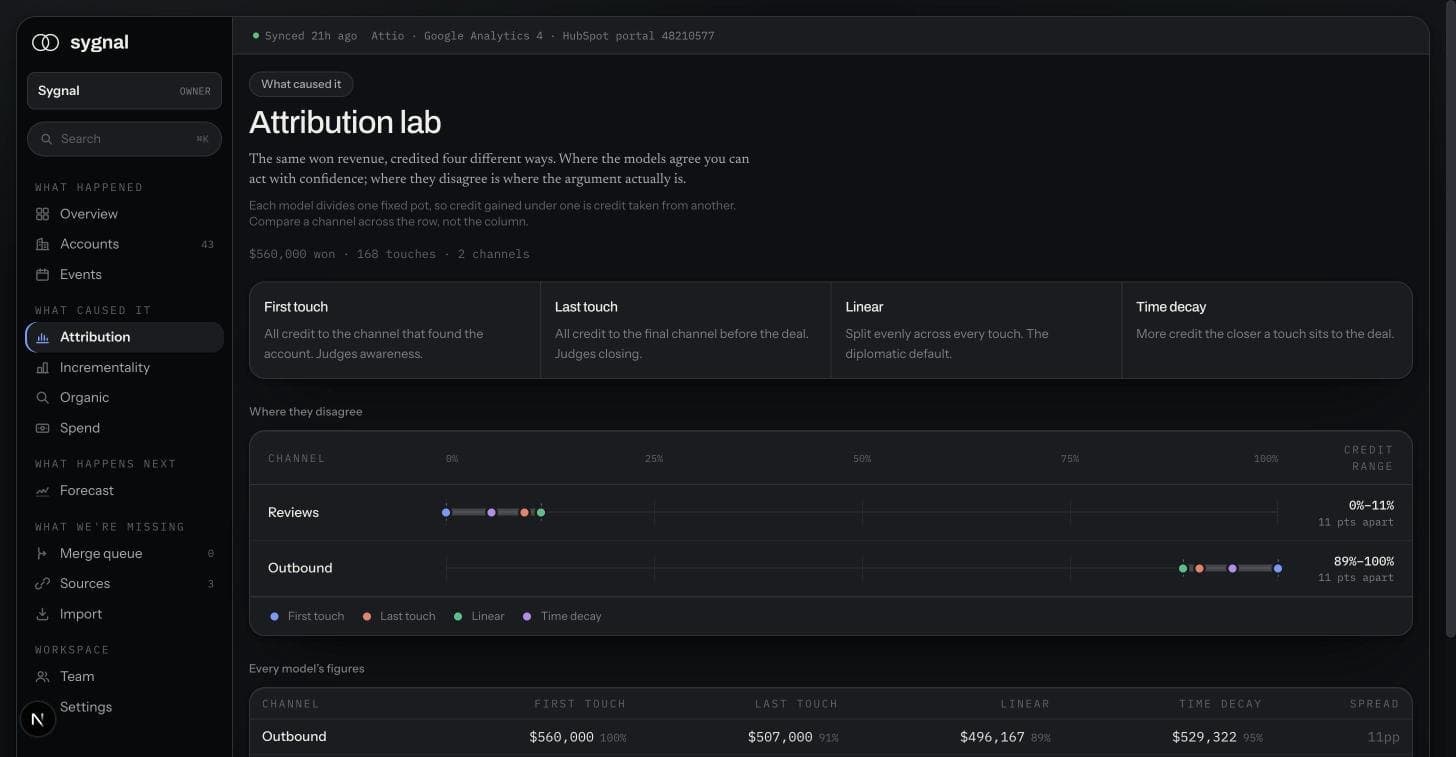
Attribution Lab
Compare four attribution models side by side.
First touch, last touch, linear and time decay, recomputed live from the same journey touchpoints. Watch credit move between channels as you switch models.
Where the four models disagree most is where your reporting is hiding something. A channel that looks strong on first touch and invisible on last touch starts conversations it does not finish, and that is a budget decision, not a reporting error.
Events and webinars
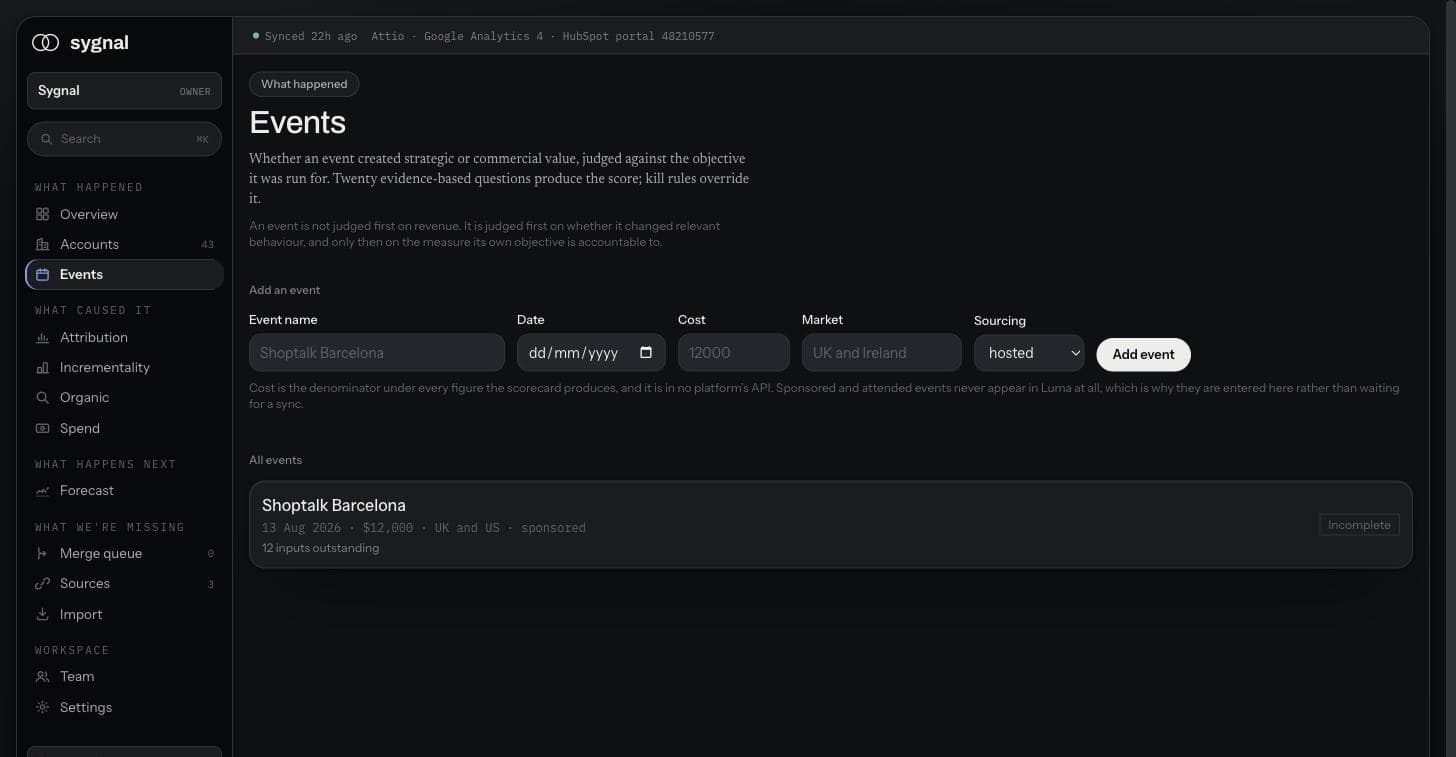
Measure the channels with no click on them.
Every event you run, with its cost, its market and whether you hosted or sponsored it. Attendees are matched to accounts, then compared against a baseline of accounts never exposed to an event at all.
An event is scored on whether it changed behaviour before it is scored on revenue. The comparison is observational, not a randomised holdout, and the product says so on screen rather than in a footnote.
Company journeys
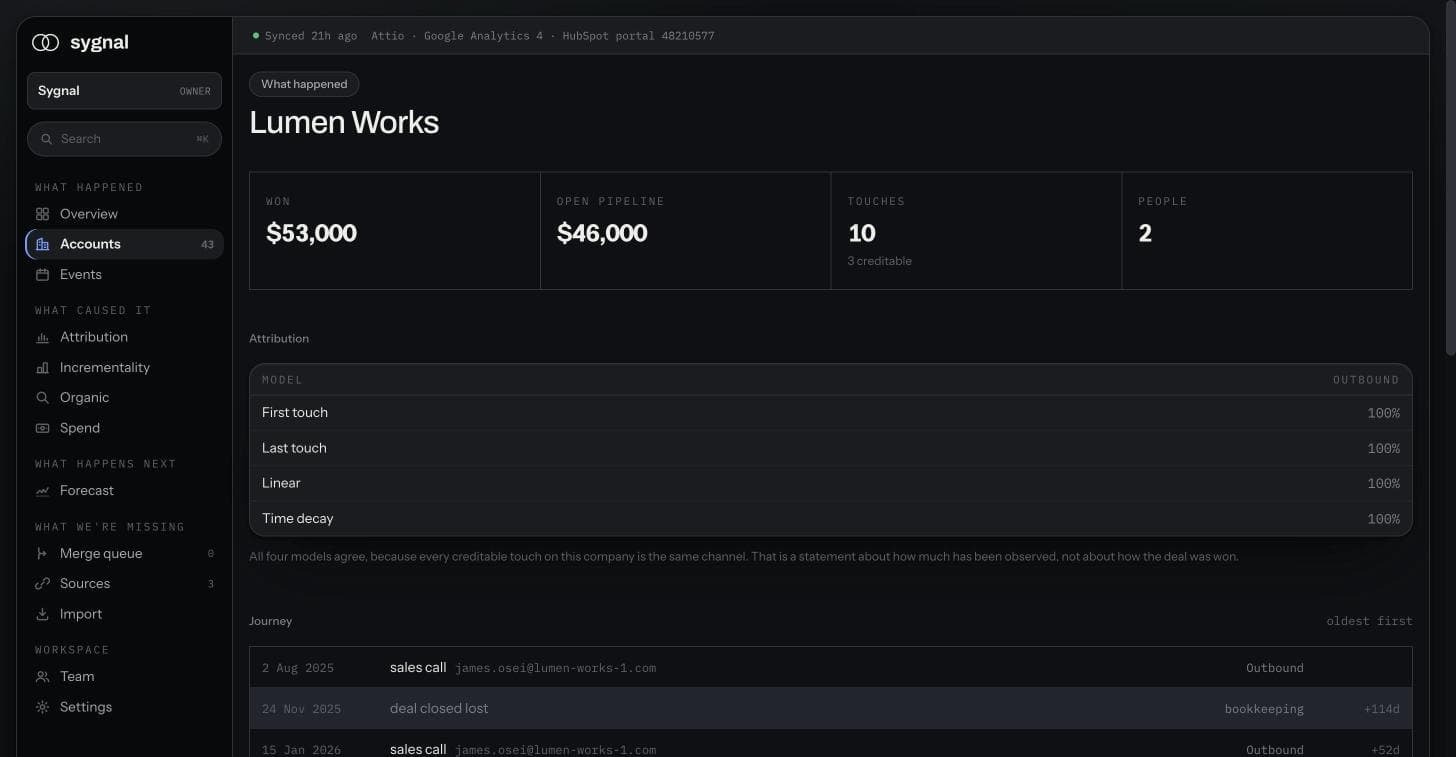
Follow every company from first touch to closed.
Every account gets a full timeline, from the first anonymous touch to the deal closing. The ones you won, and the ones you lost.
If you cannot see who is in a number, you should not believe it. Every figure here opens into the named companies behind it.
Bring your channel mix.
Twenty minutes, screen shared, and you can pick the channel you are least sure about.